On September 3rd and 4th 2020 an electrical resistivity and a self-potential survey were performed. The purpose of these two surveys is to identify seepage areas. A seepage area is an area where ground water is flowing along paths under and around the dam. Both surveys are noninvasive to the soils and surrounding plants. Just like medical imaging allows a doctor to see what is inside of a person’s body, these surveys allow engineers to see into the ground to locate areas where repairs may be needed.
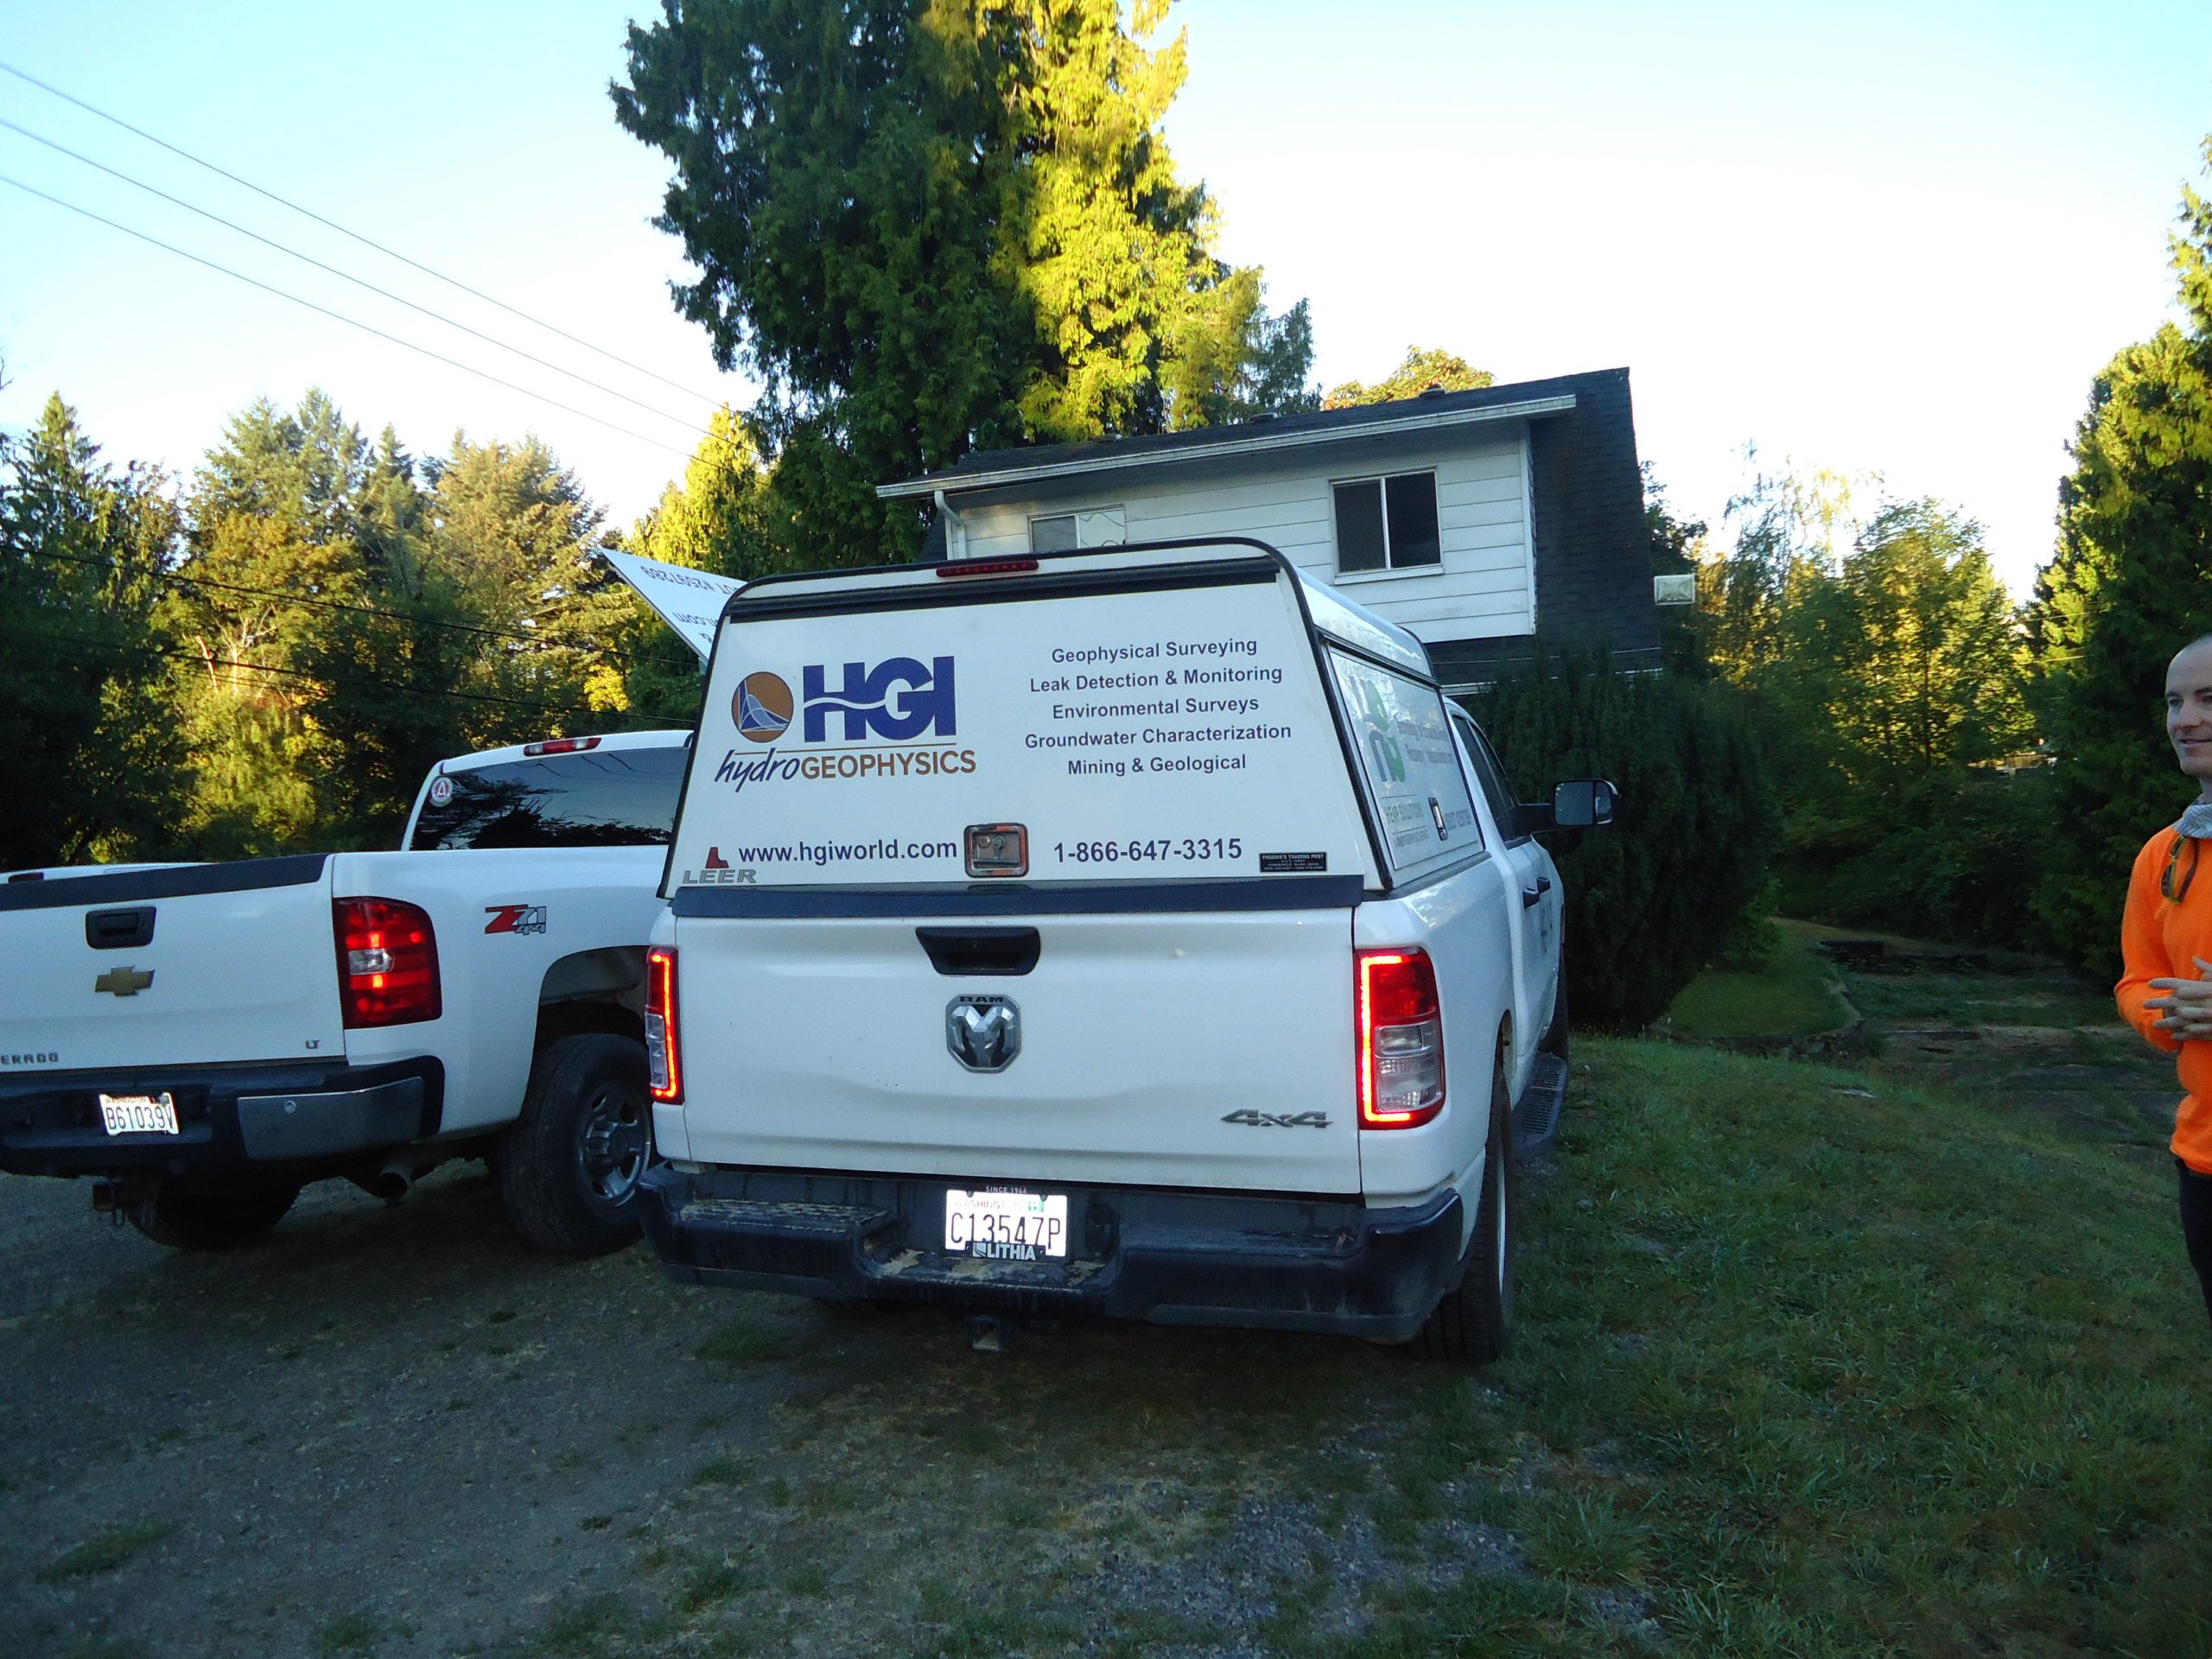
These surveys were performed by HGI hydro geophysics group, as seen below:
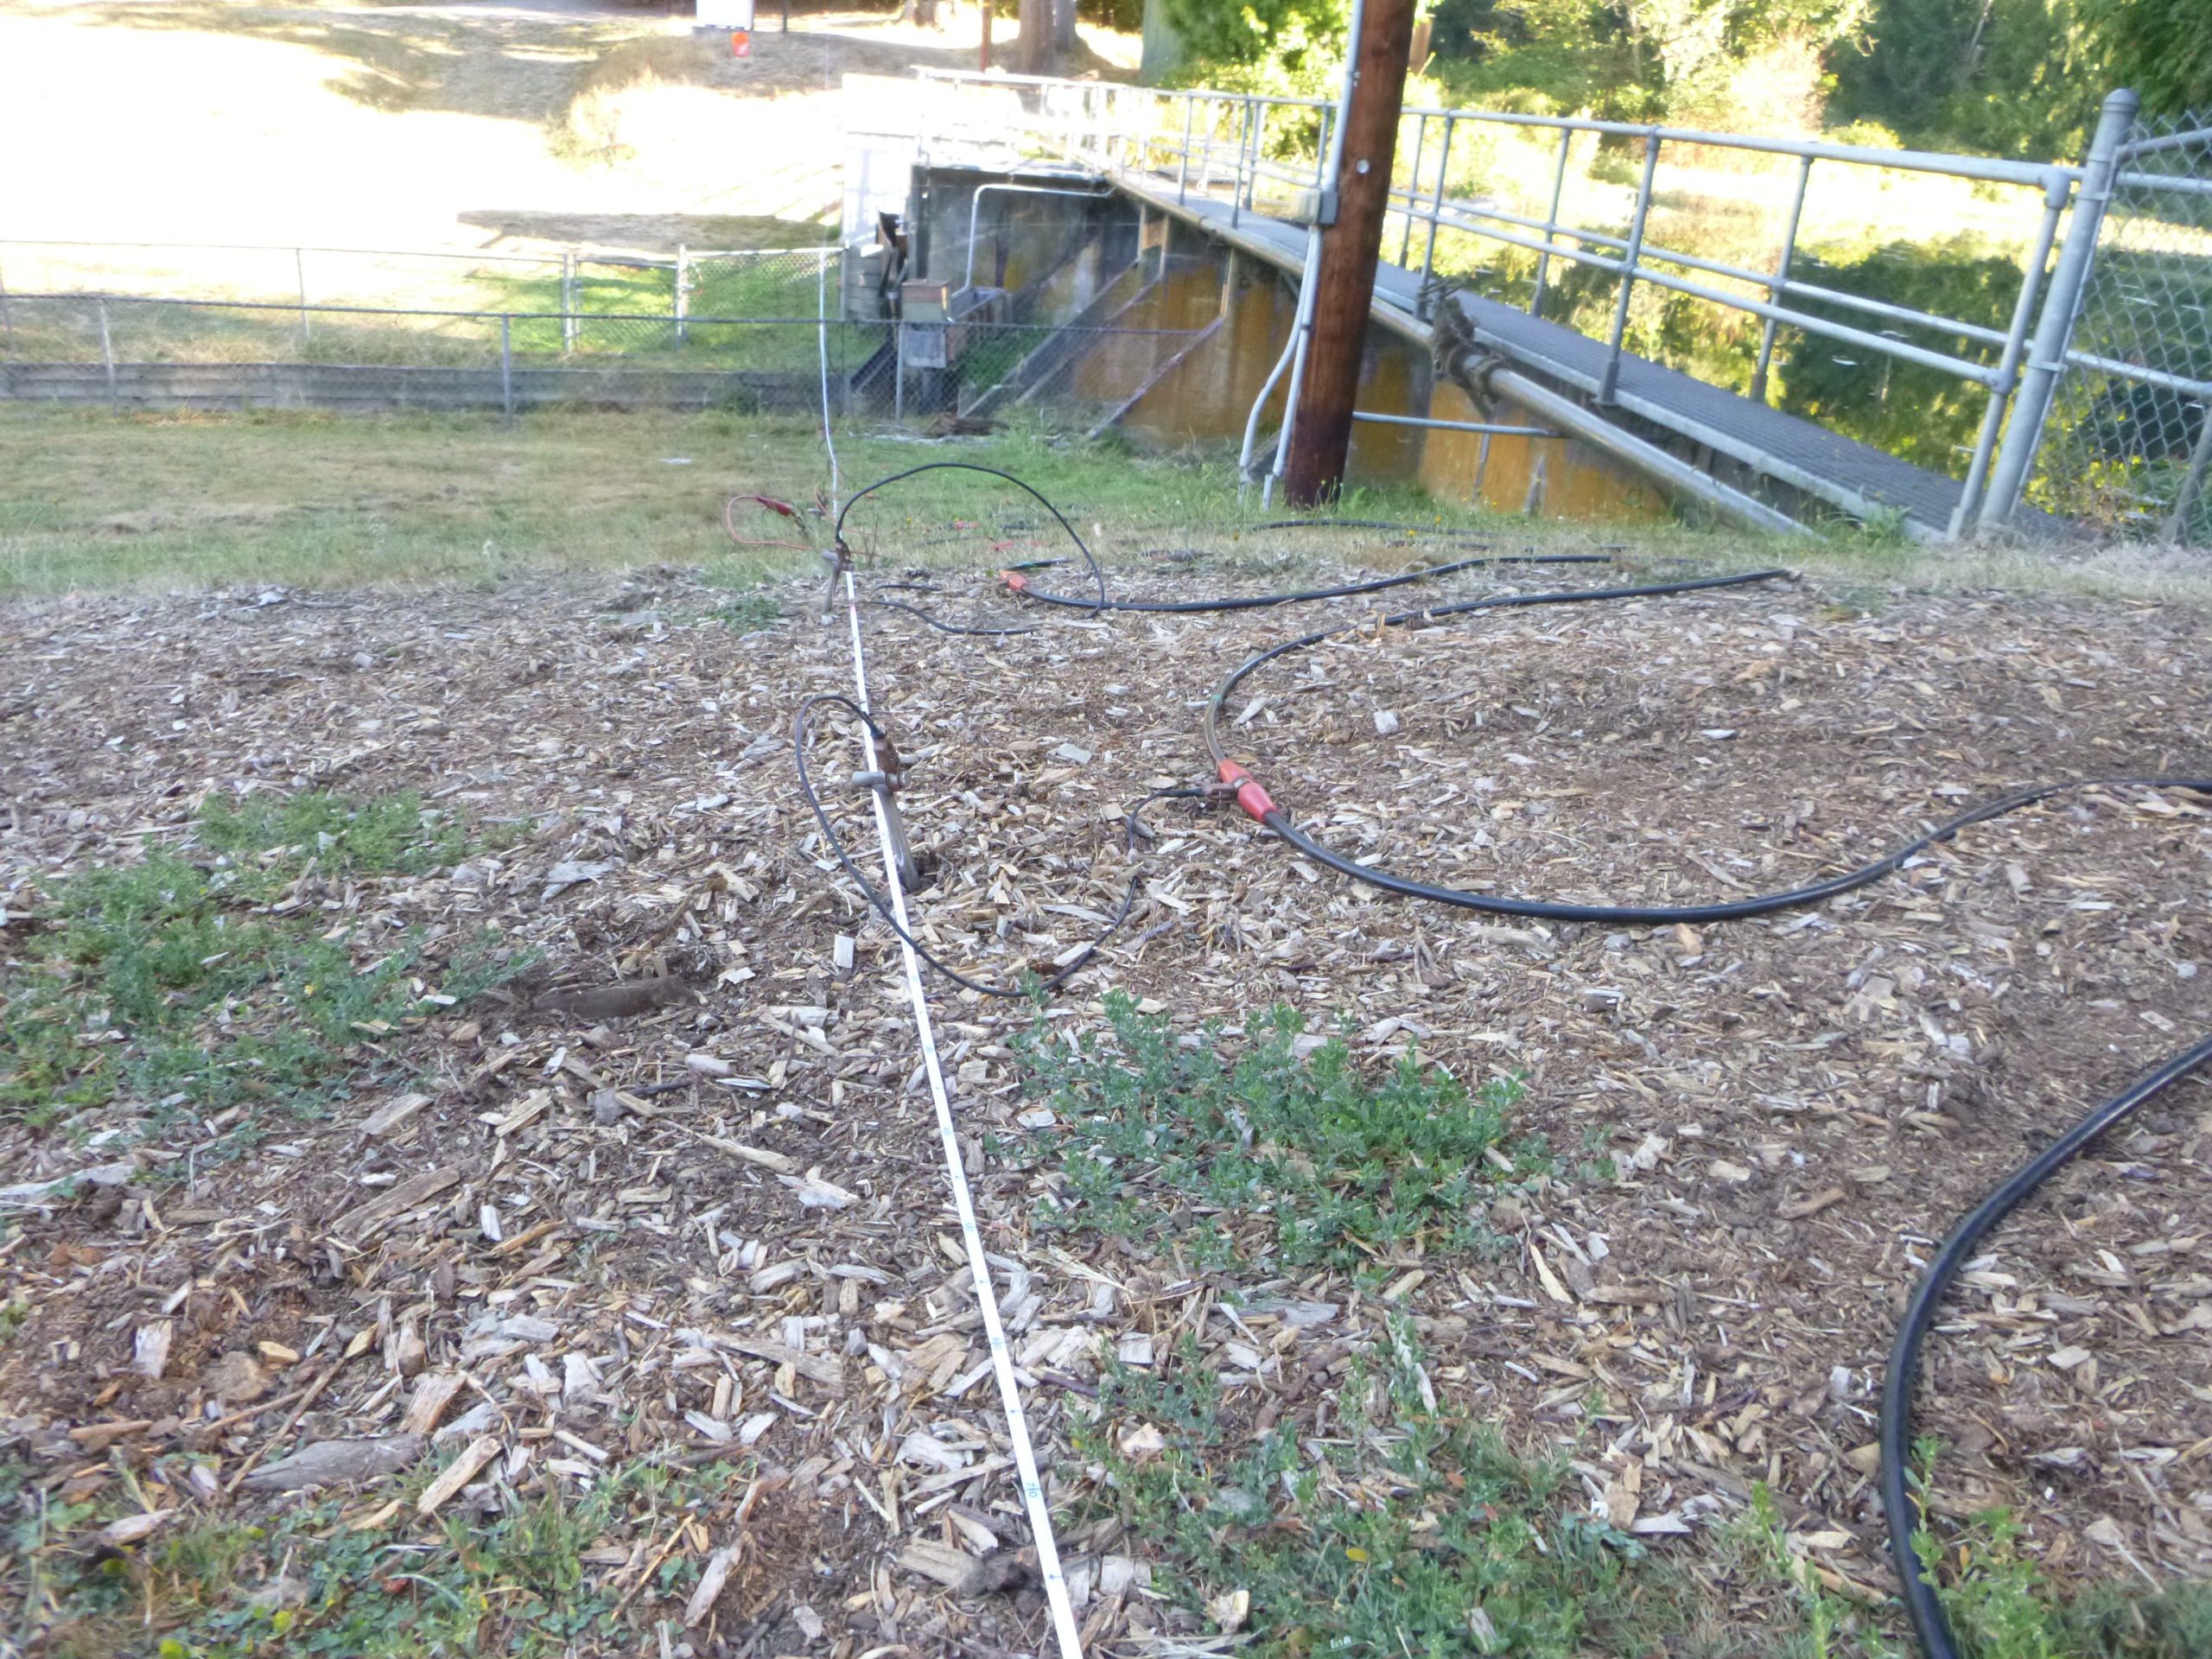
The first survey performed is called an electrical resistivity survey. This survey consisted of placing long lines of wire parallel to the dam and connecting these wires to large metal stakes hammered into the ground. A small amount of electricity is then transferred through the wire and into the ground through the stakes. Each set of wire connected to the stakes is referred to as a “line”. An example of a line can be seen in the image below.
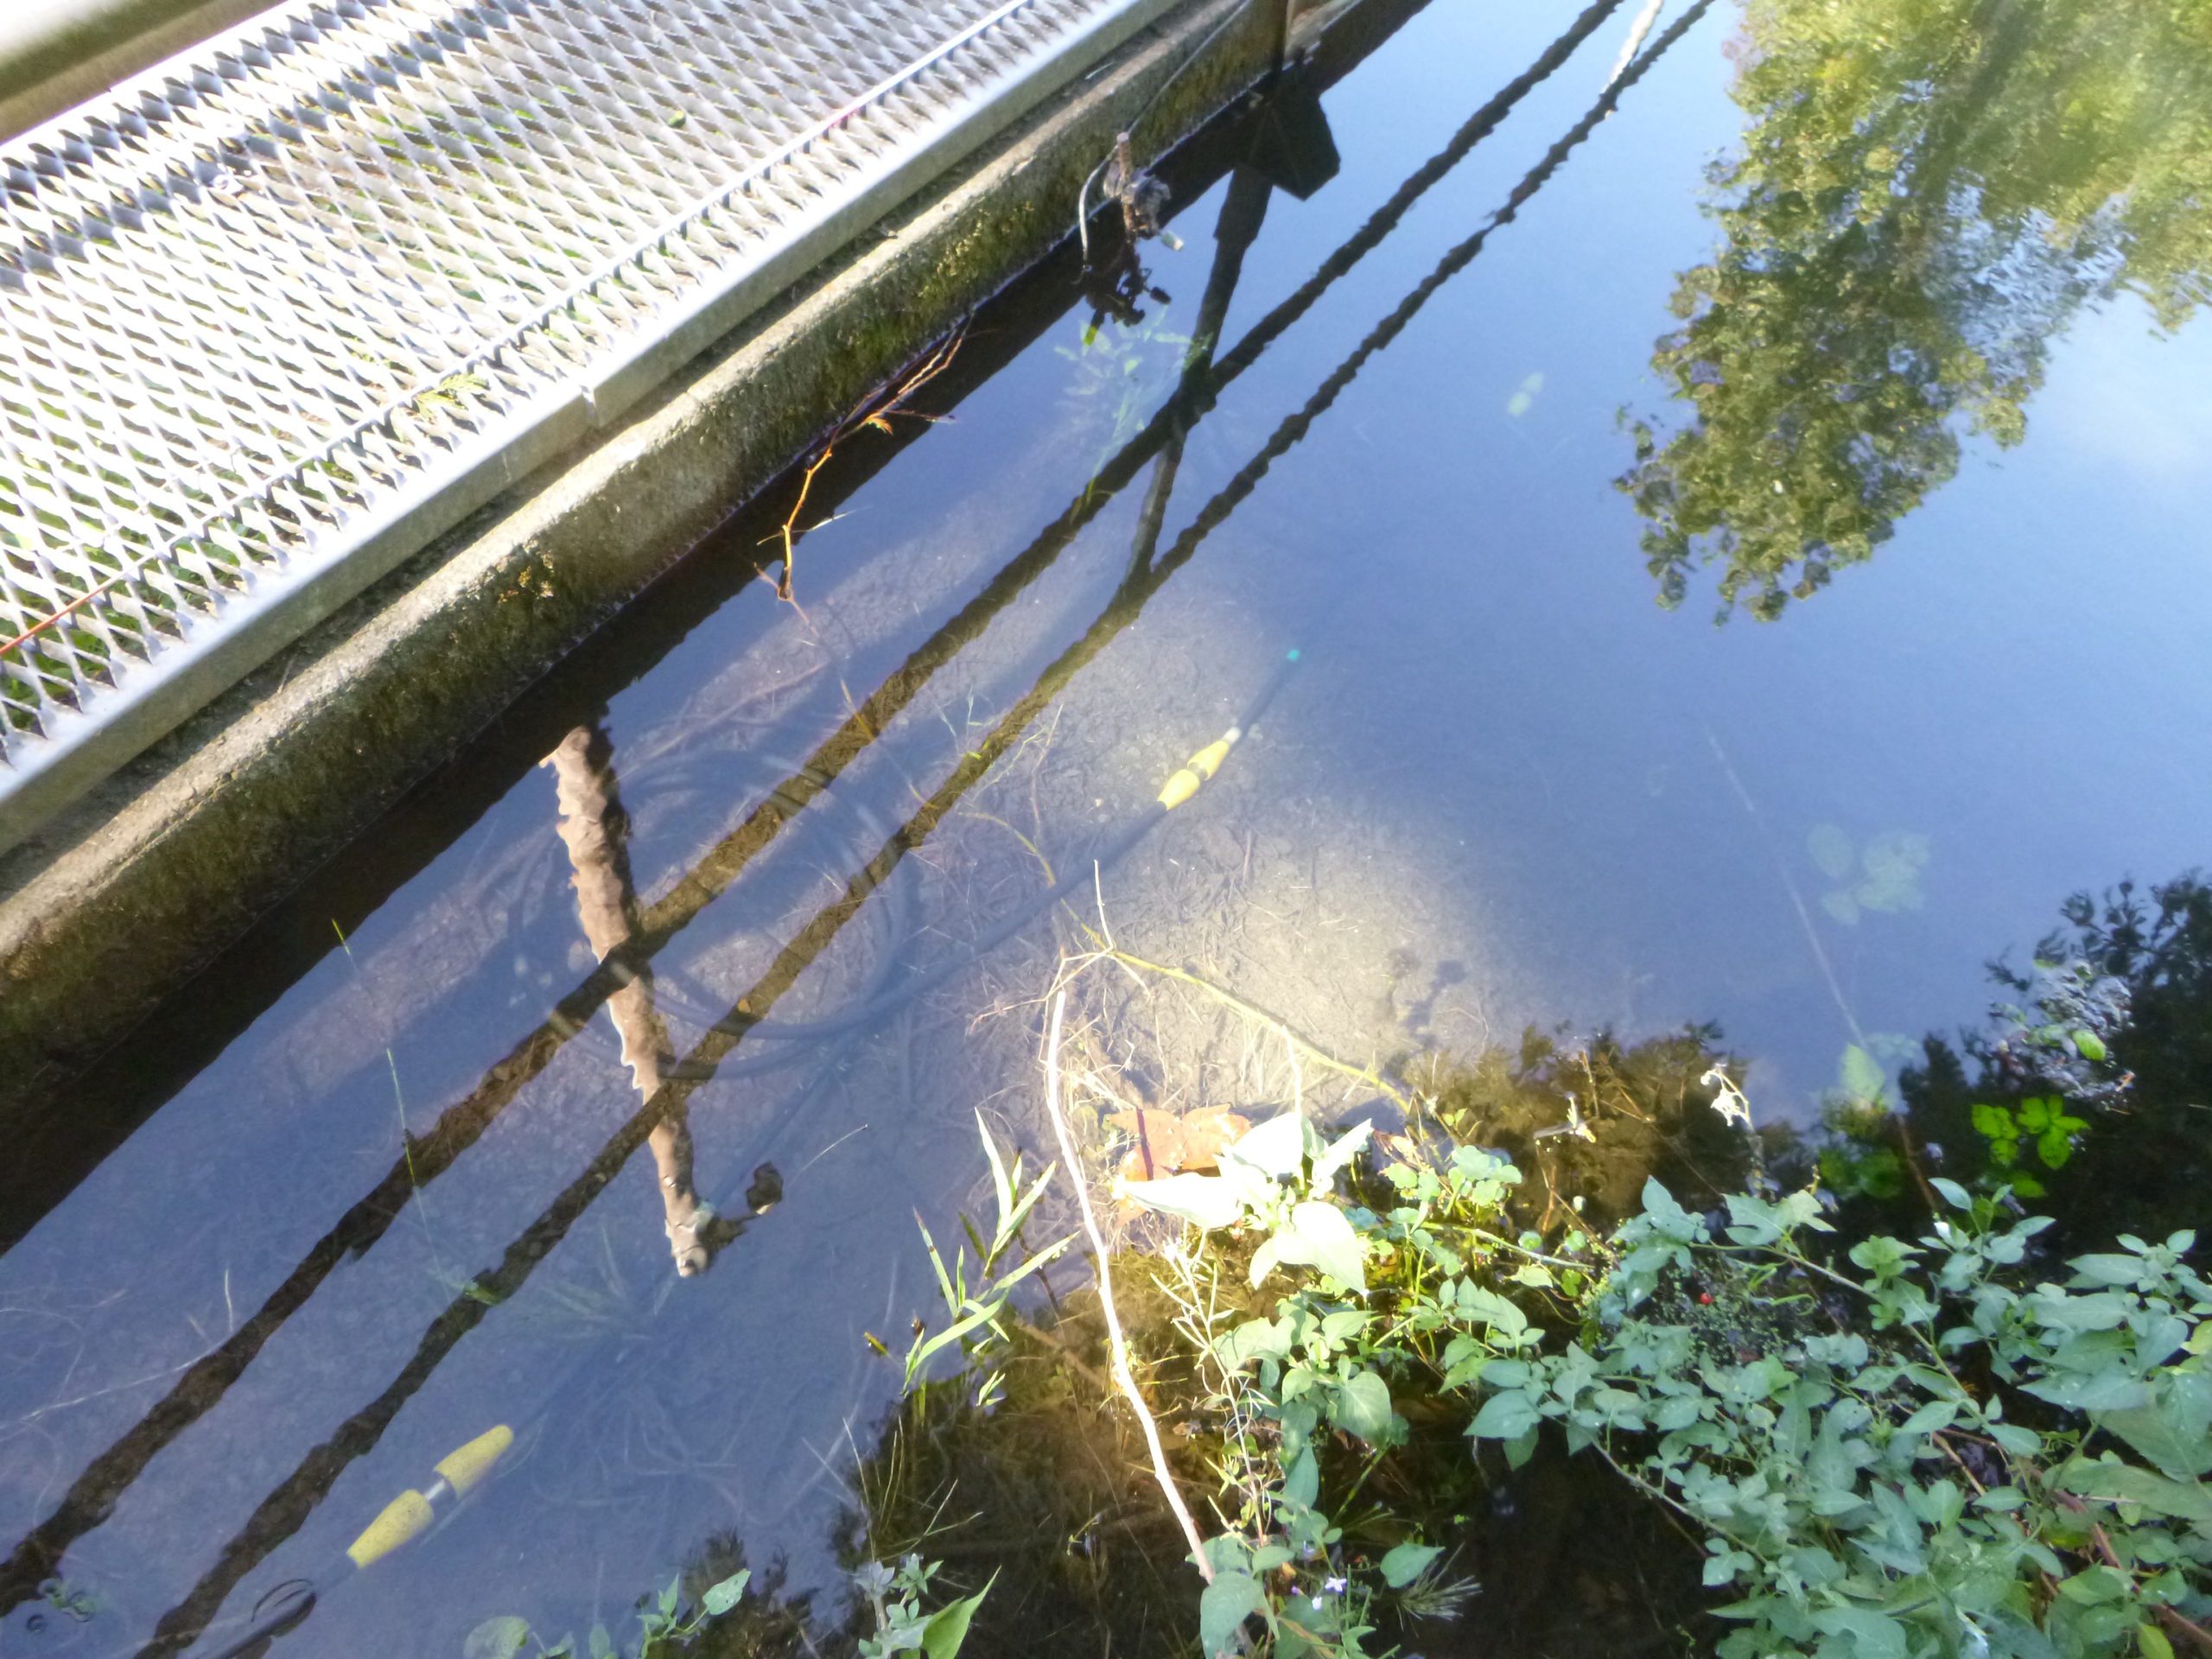
Four lines of wire were set up parallel to the dam; three downstream of the dam and one upstream of the dam. An image of the line upstream of the dam is shown below:
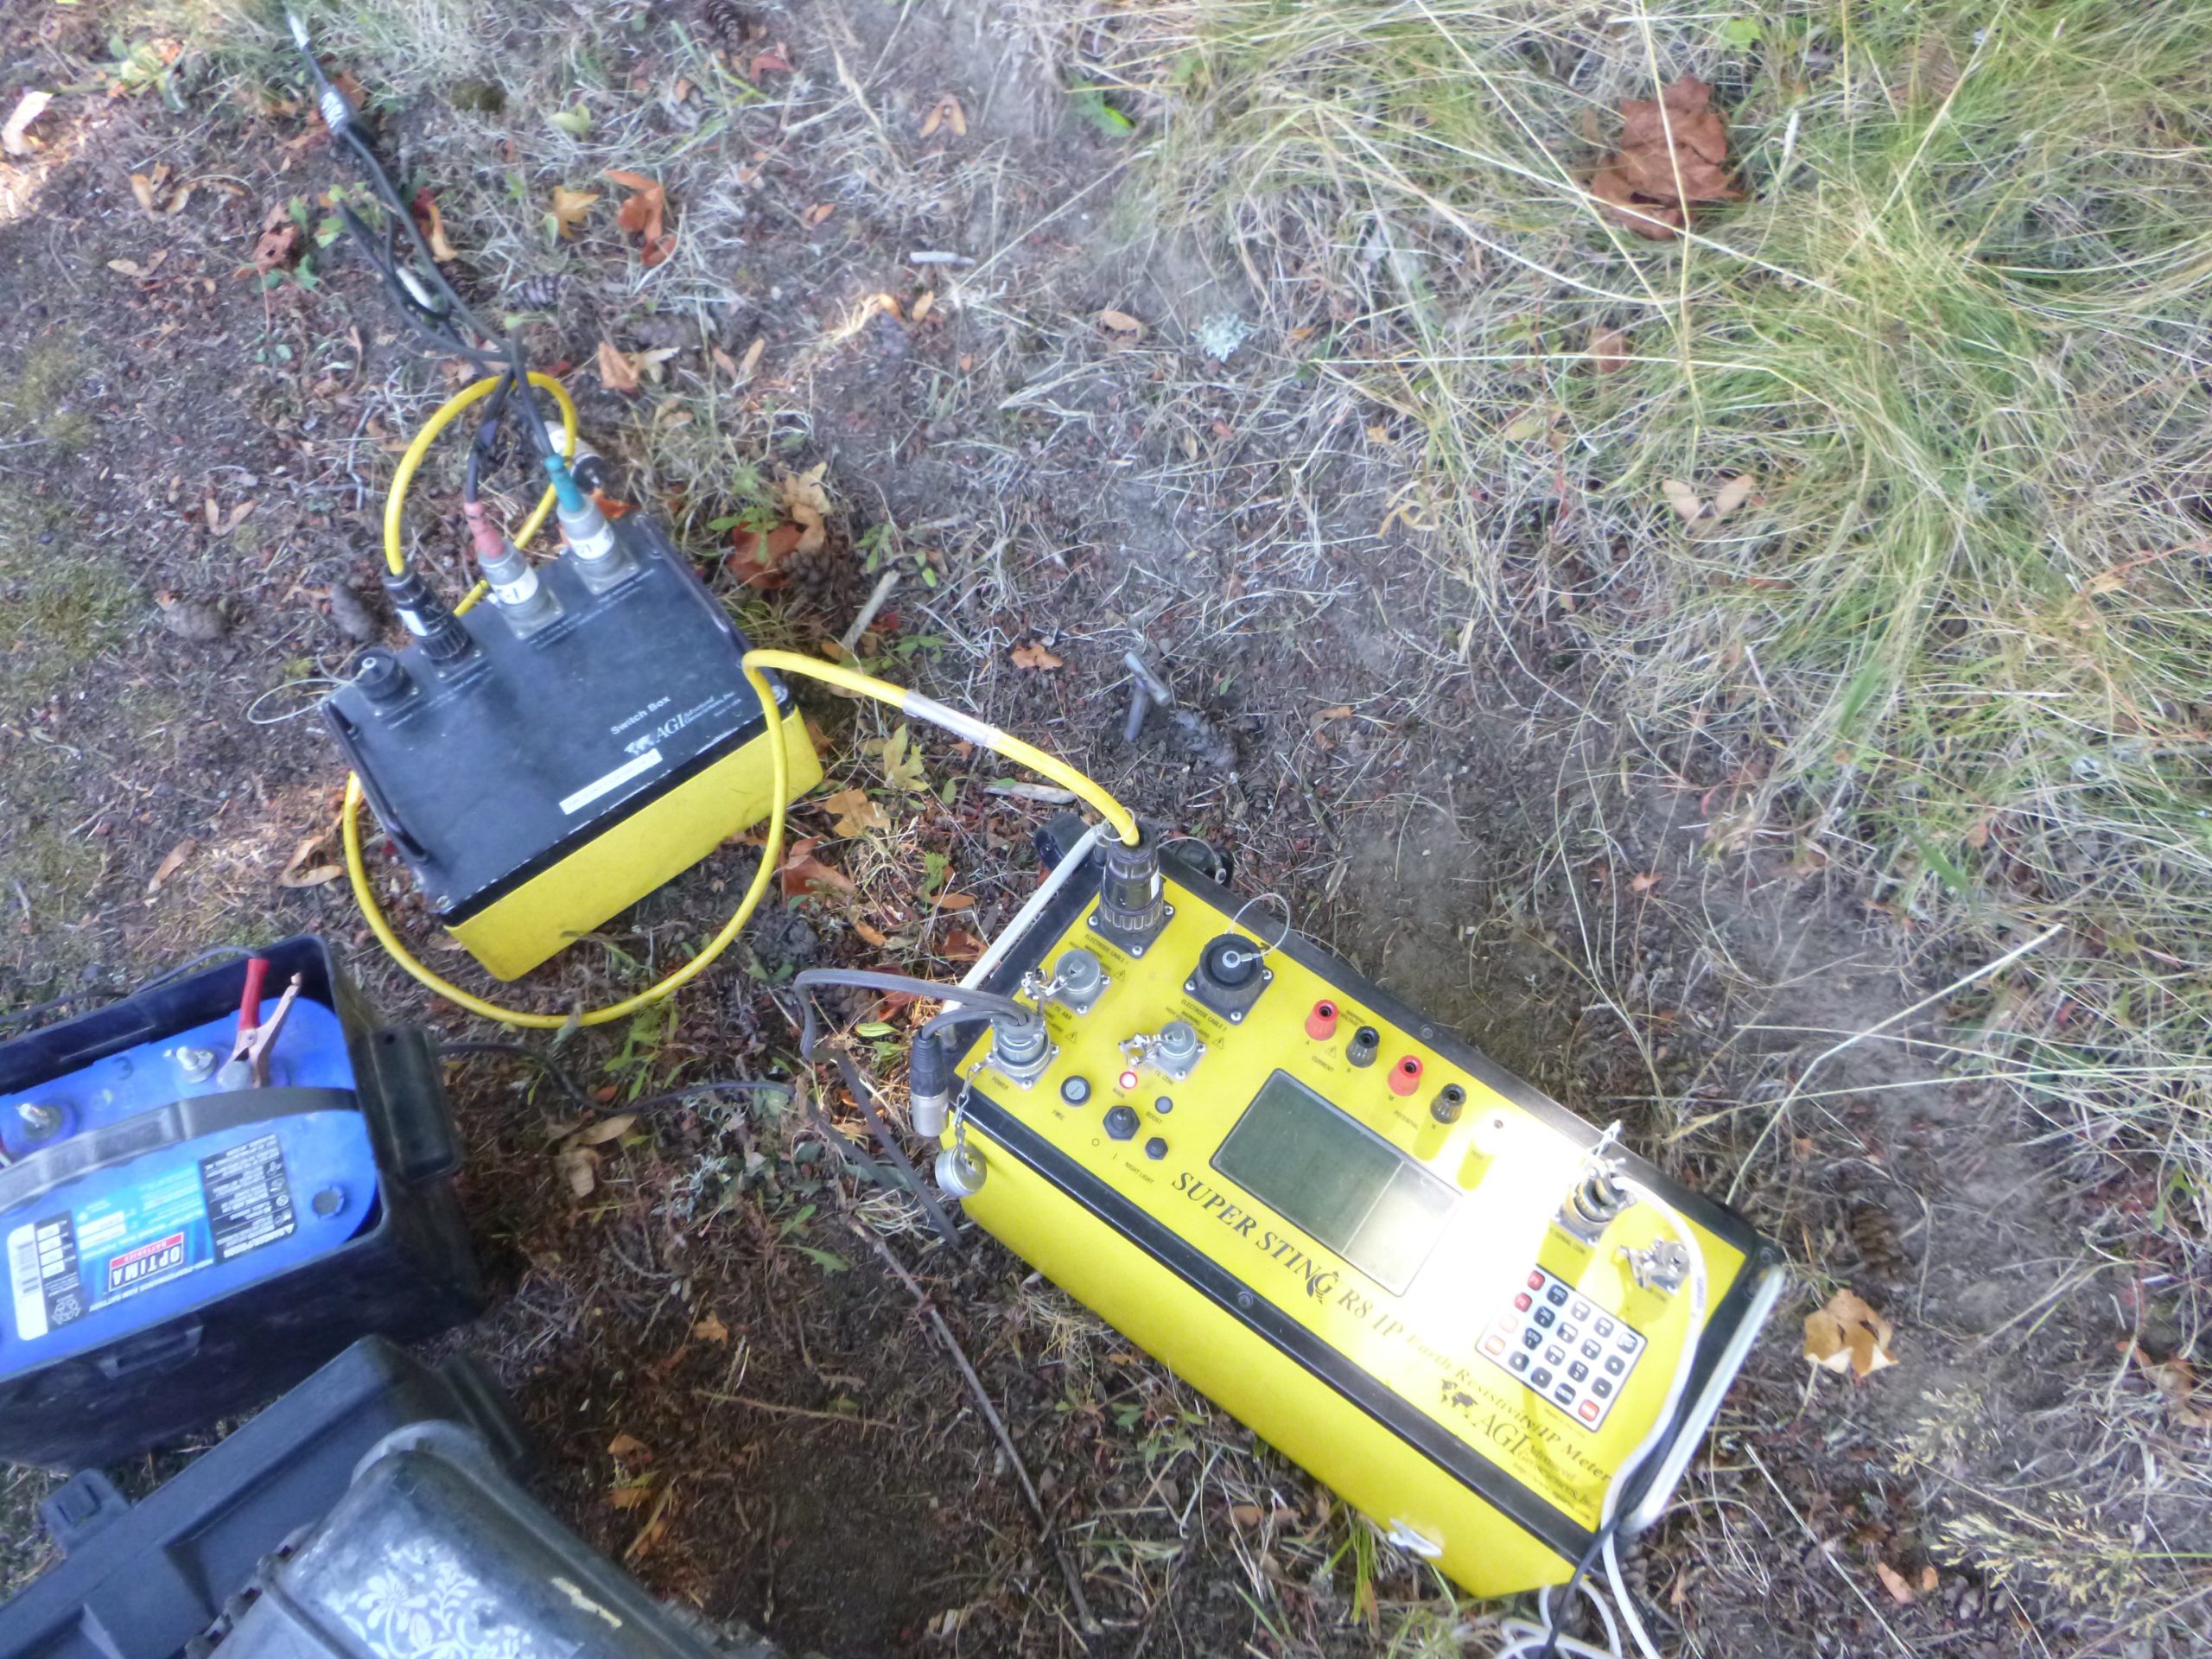
A switch box controls the amount of electricity sent through the wire and the stakes. The switch box also sends readings to a computer. The computer records the amount of resistance along the line in respect to vertical elevation below the surface. Resistance measures how easily an electrical current will pass through a substance. Different substances (rock, clay, water) have different resistance to electricity.
After setup, each line sent electricity into the earth for 60 minutes and recorded the resistance data onto the computer. Only one line is run at a time to avoid interreference. After an hour had passed, the quality of the data was confirmed. After the site visit, HGI processed the collected data into a useable format by translating the different resistance levels into different substances.
The switch box can be seen in the image below:
The second survey performed is called a self-potential survey. Porous pots were utilized for this survey. A porous pot (pictured below) is a small, cylindrical, electrode that allows electricity naturally produced in the ground to be read with the use of a voltmeter. This small amount of electricity is conducted by water that exist in the particles of soil.
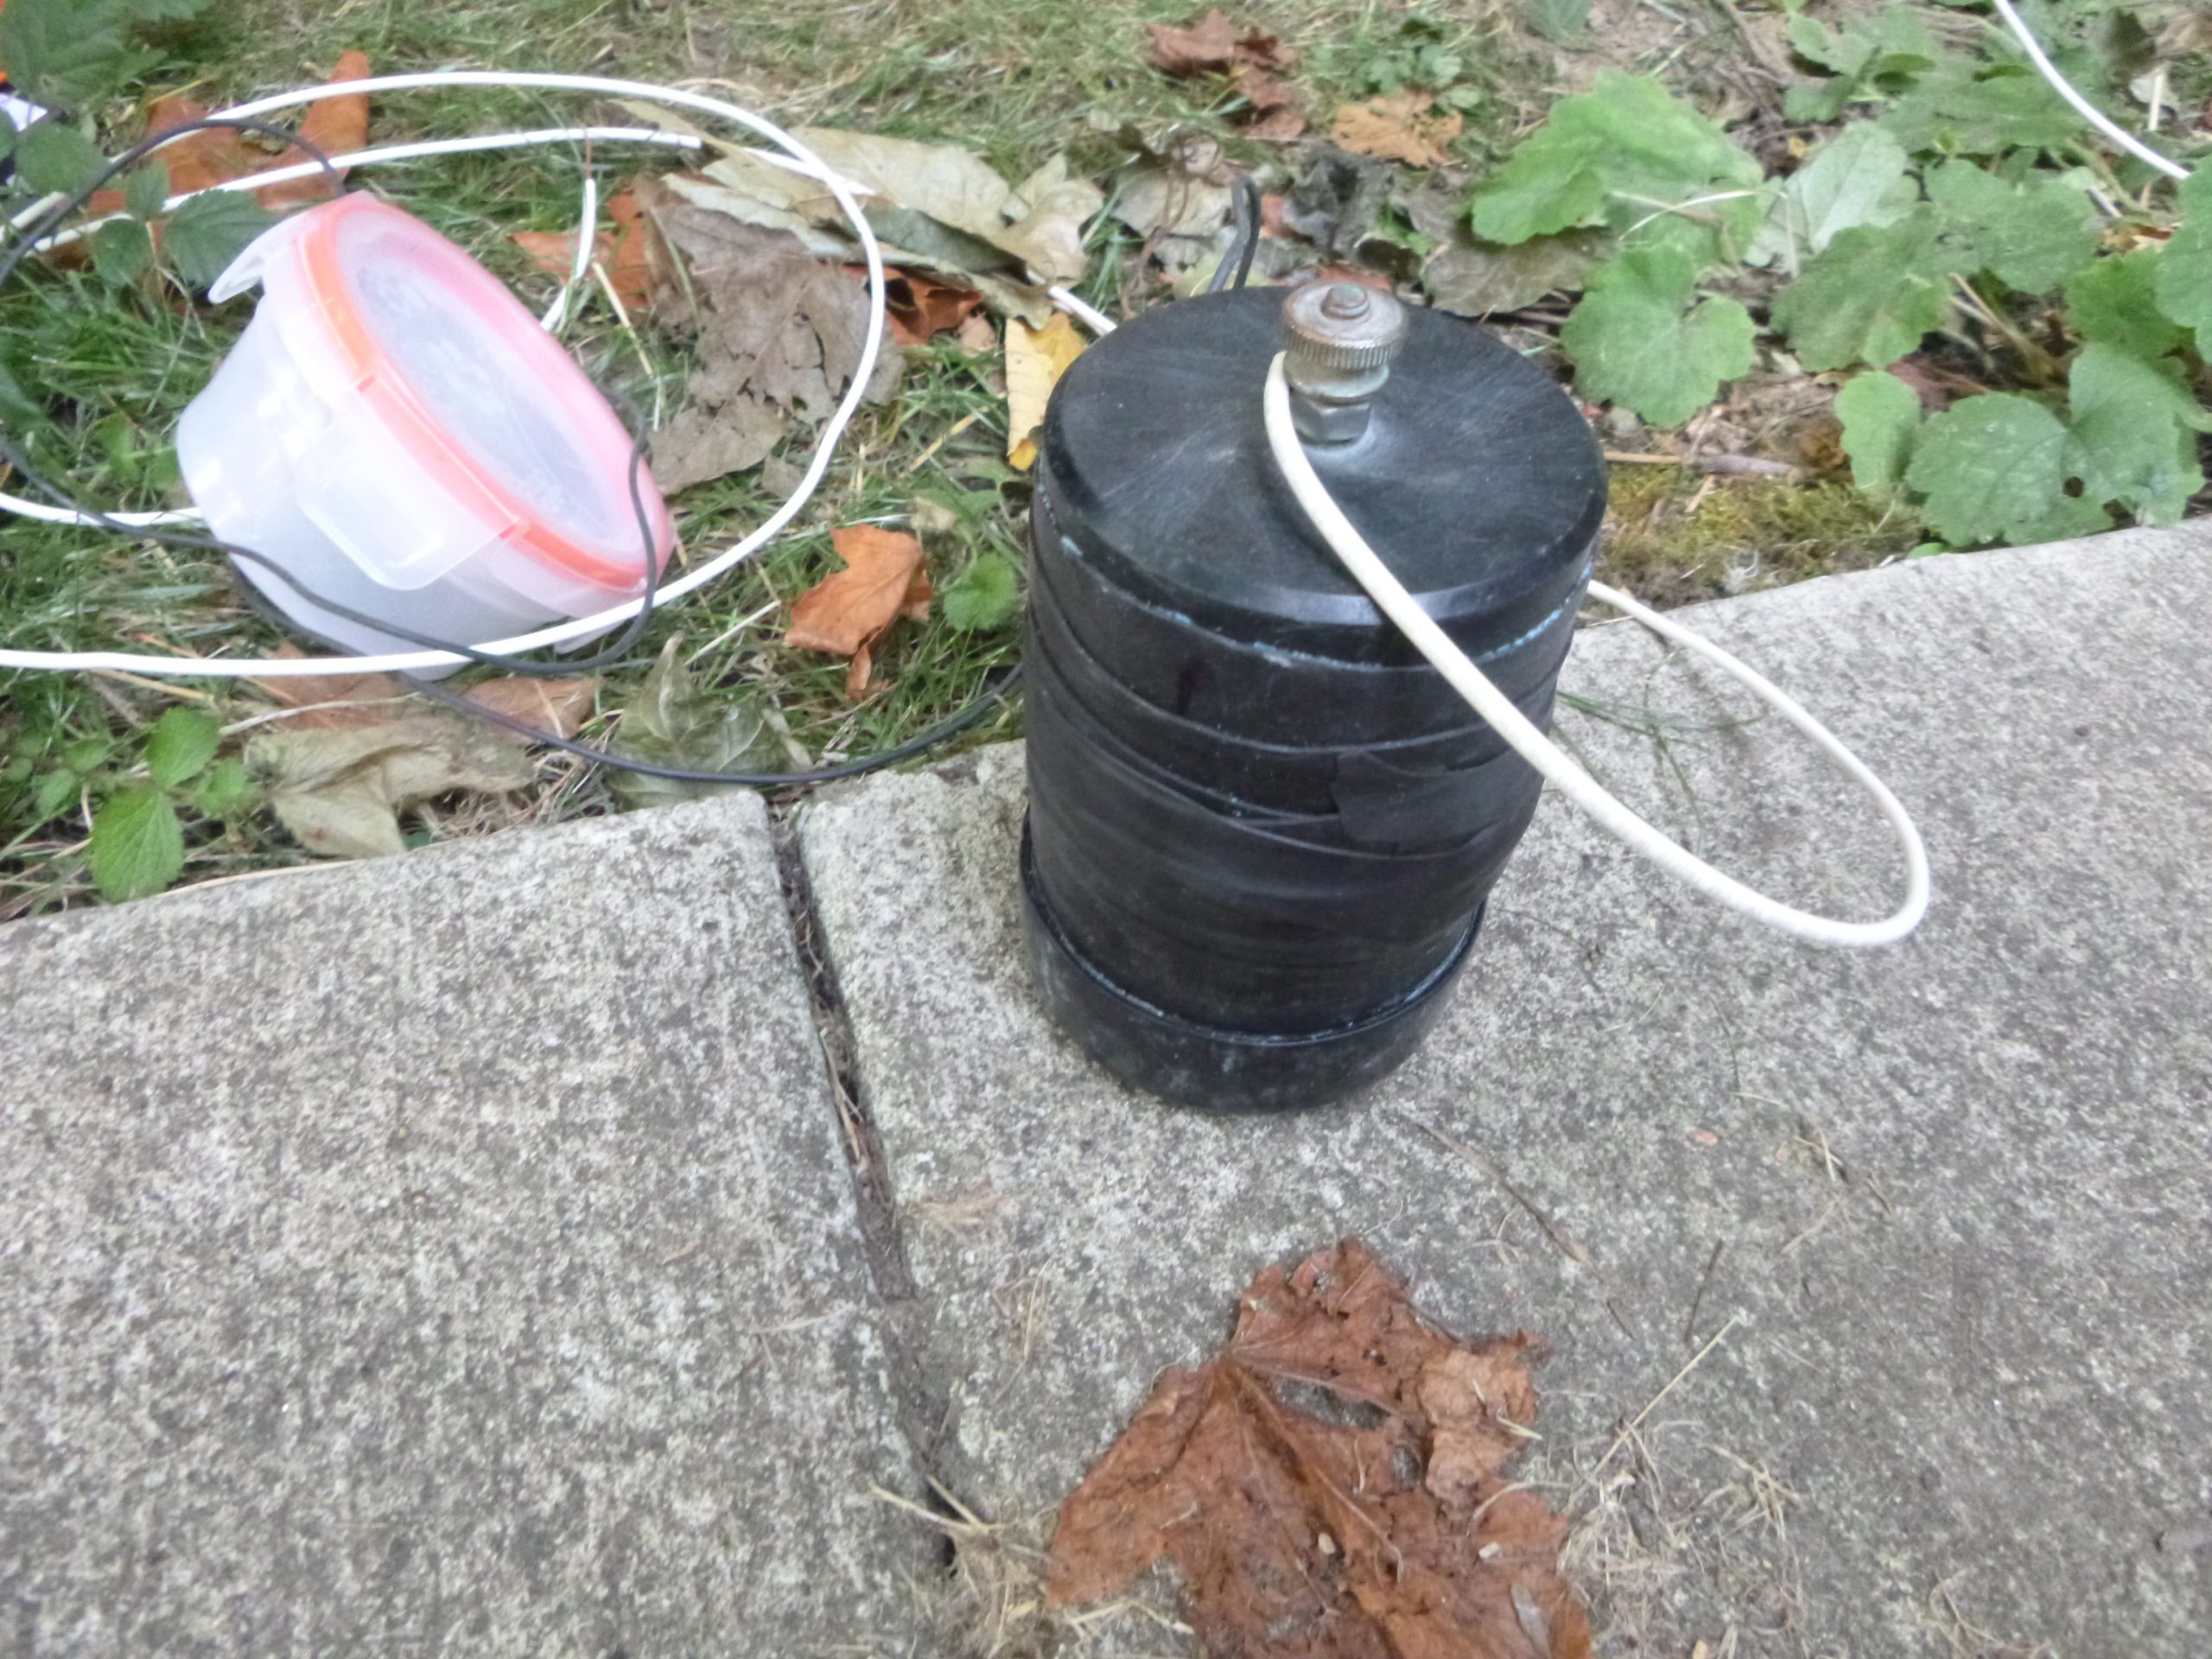
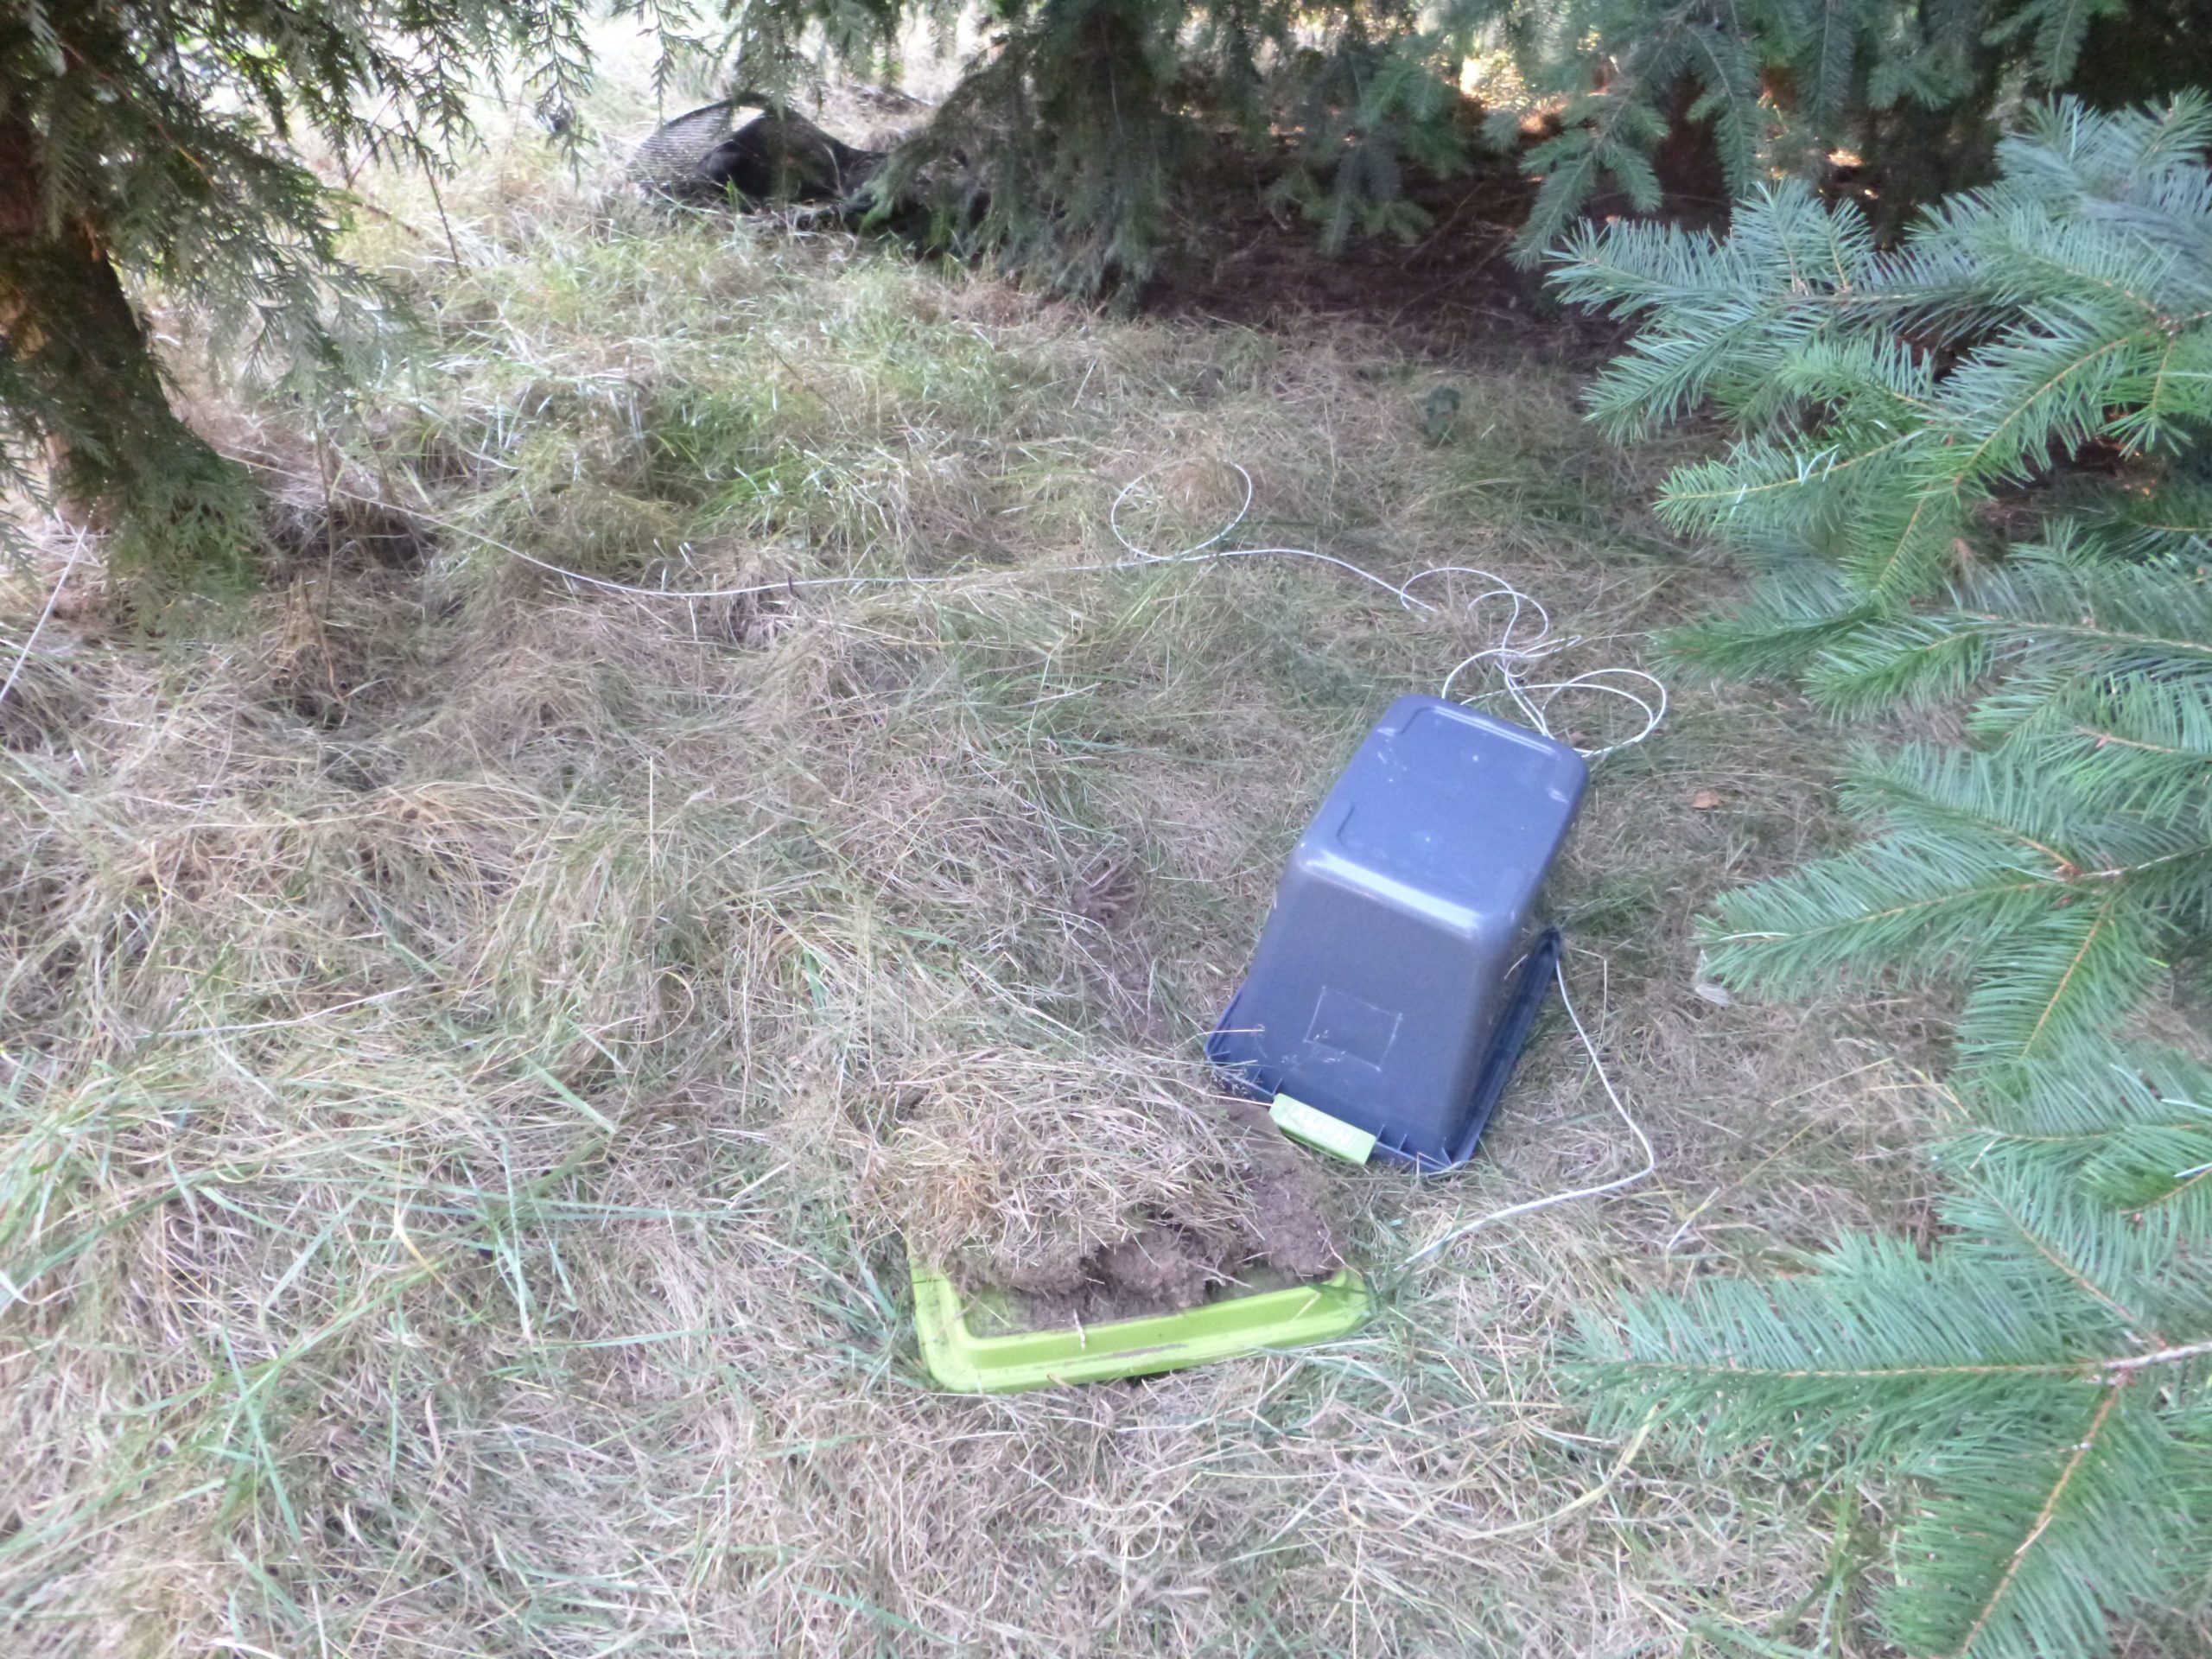
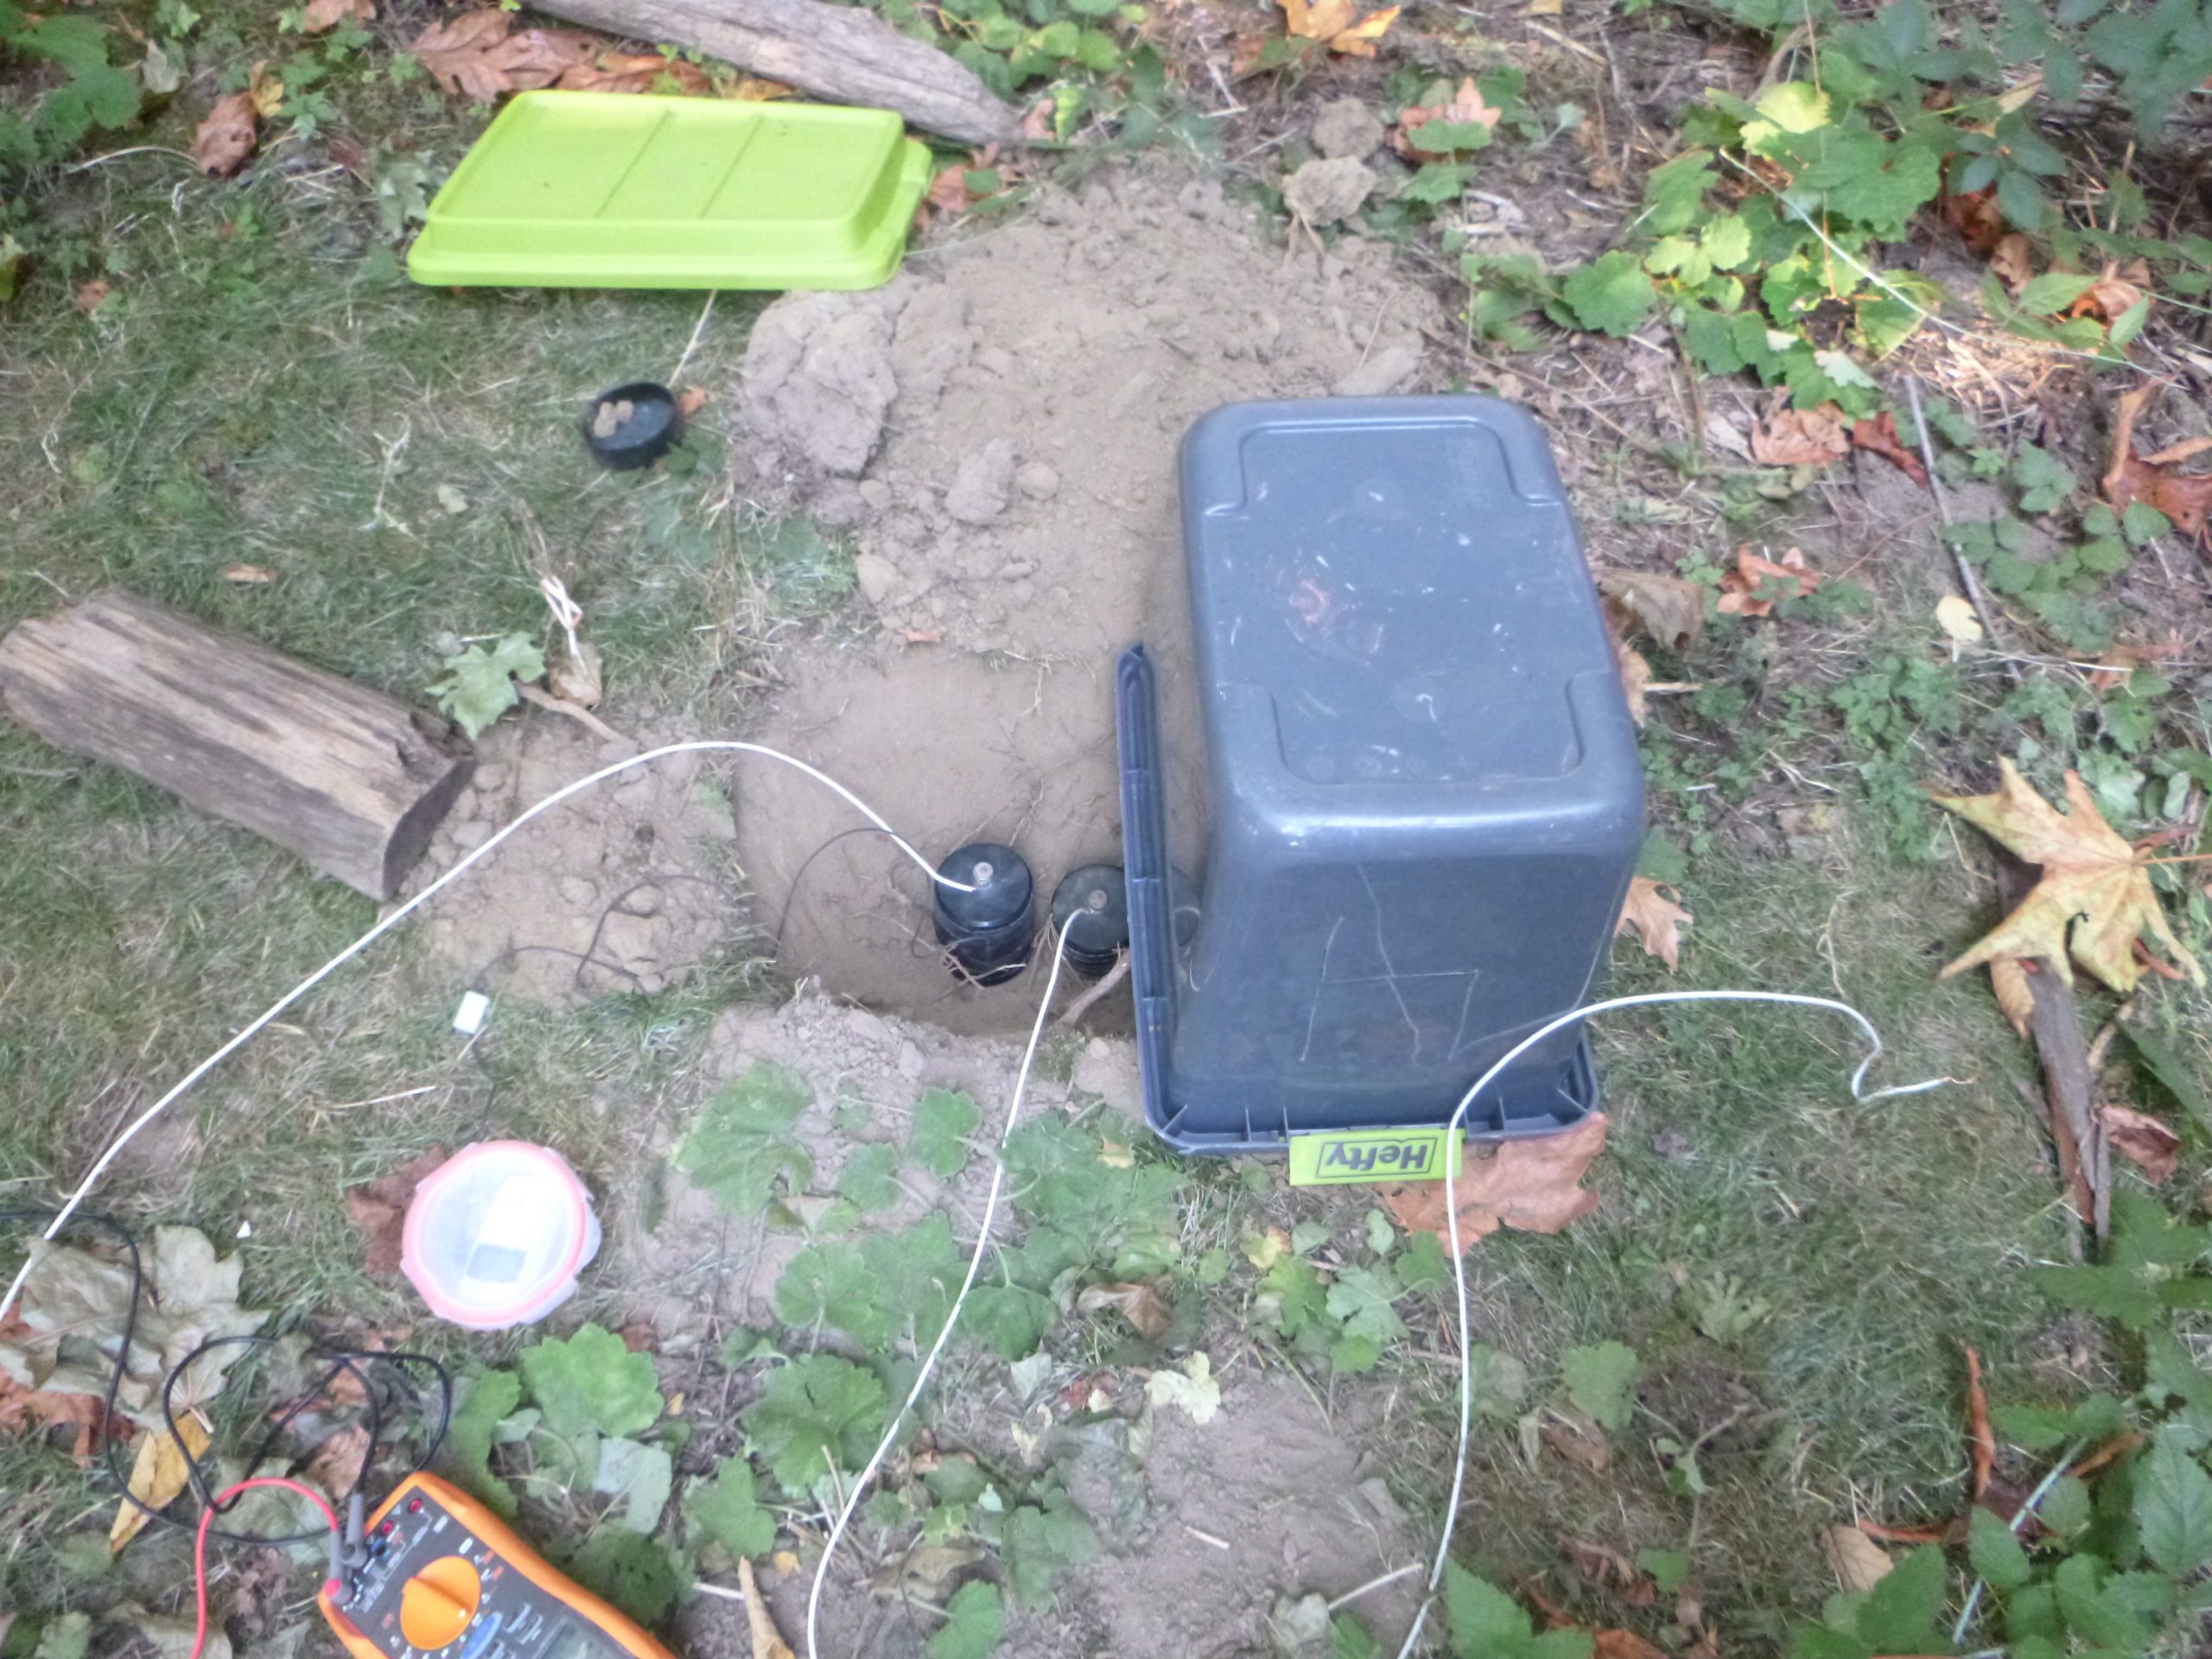
This survey consisted of the of two reference points and one mobile point. At each reference point, a small hole was dug, and a porous pot was left with the bottom, resting snug with the base of the hole. One reference point was located near East Biddle Lake, and the other local reference point, or “base point” was just north west of the West Biddle Lake dam, near the covered picnic benches. Below are images of the far reference point (left) and the base point (right). A wire was
laid connecting the far reference point to the base point, allowing the difference in voltage between the two locations to be recorded.
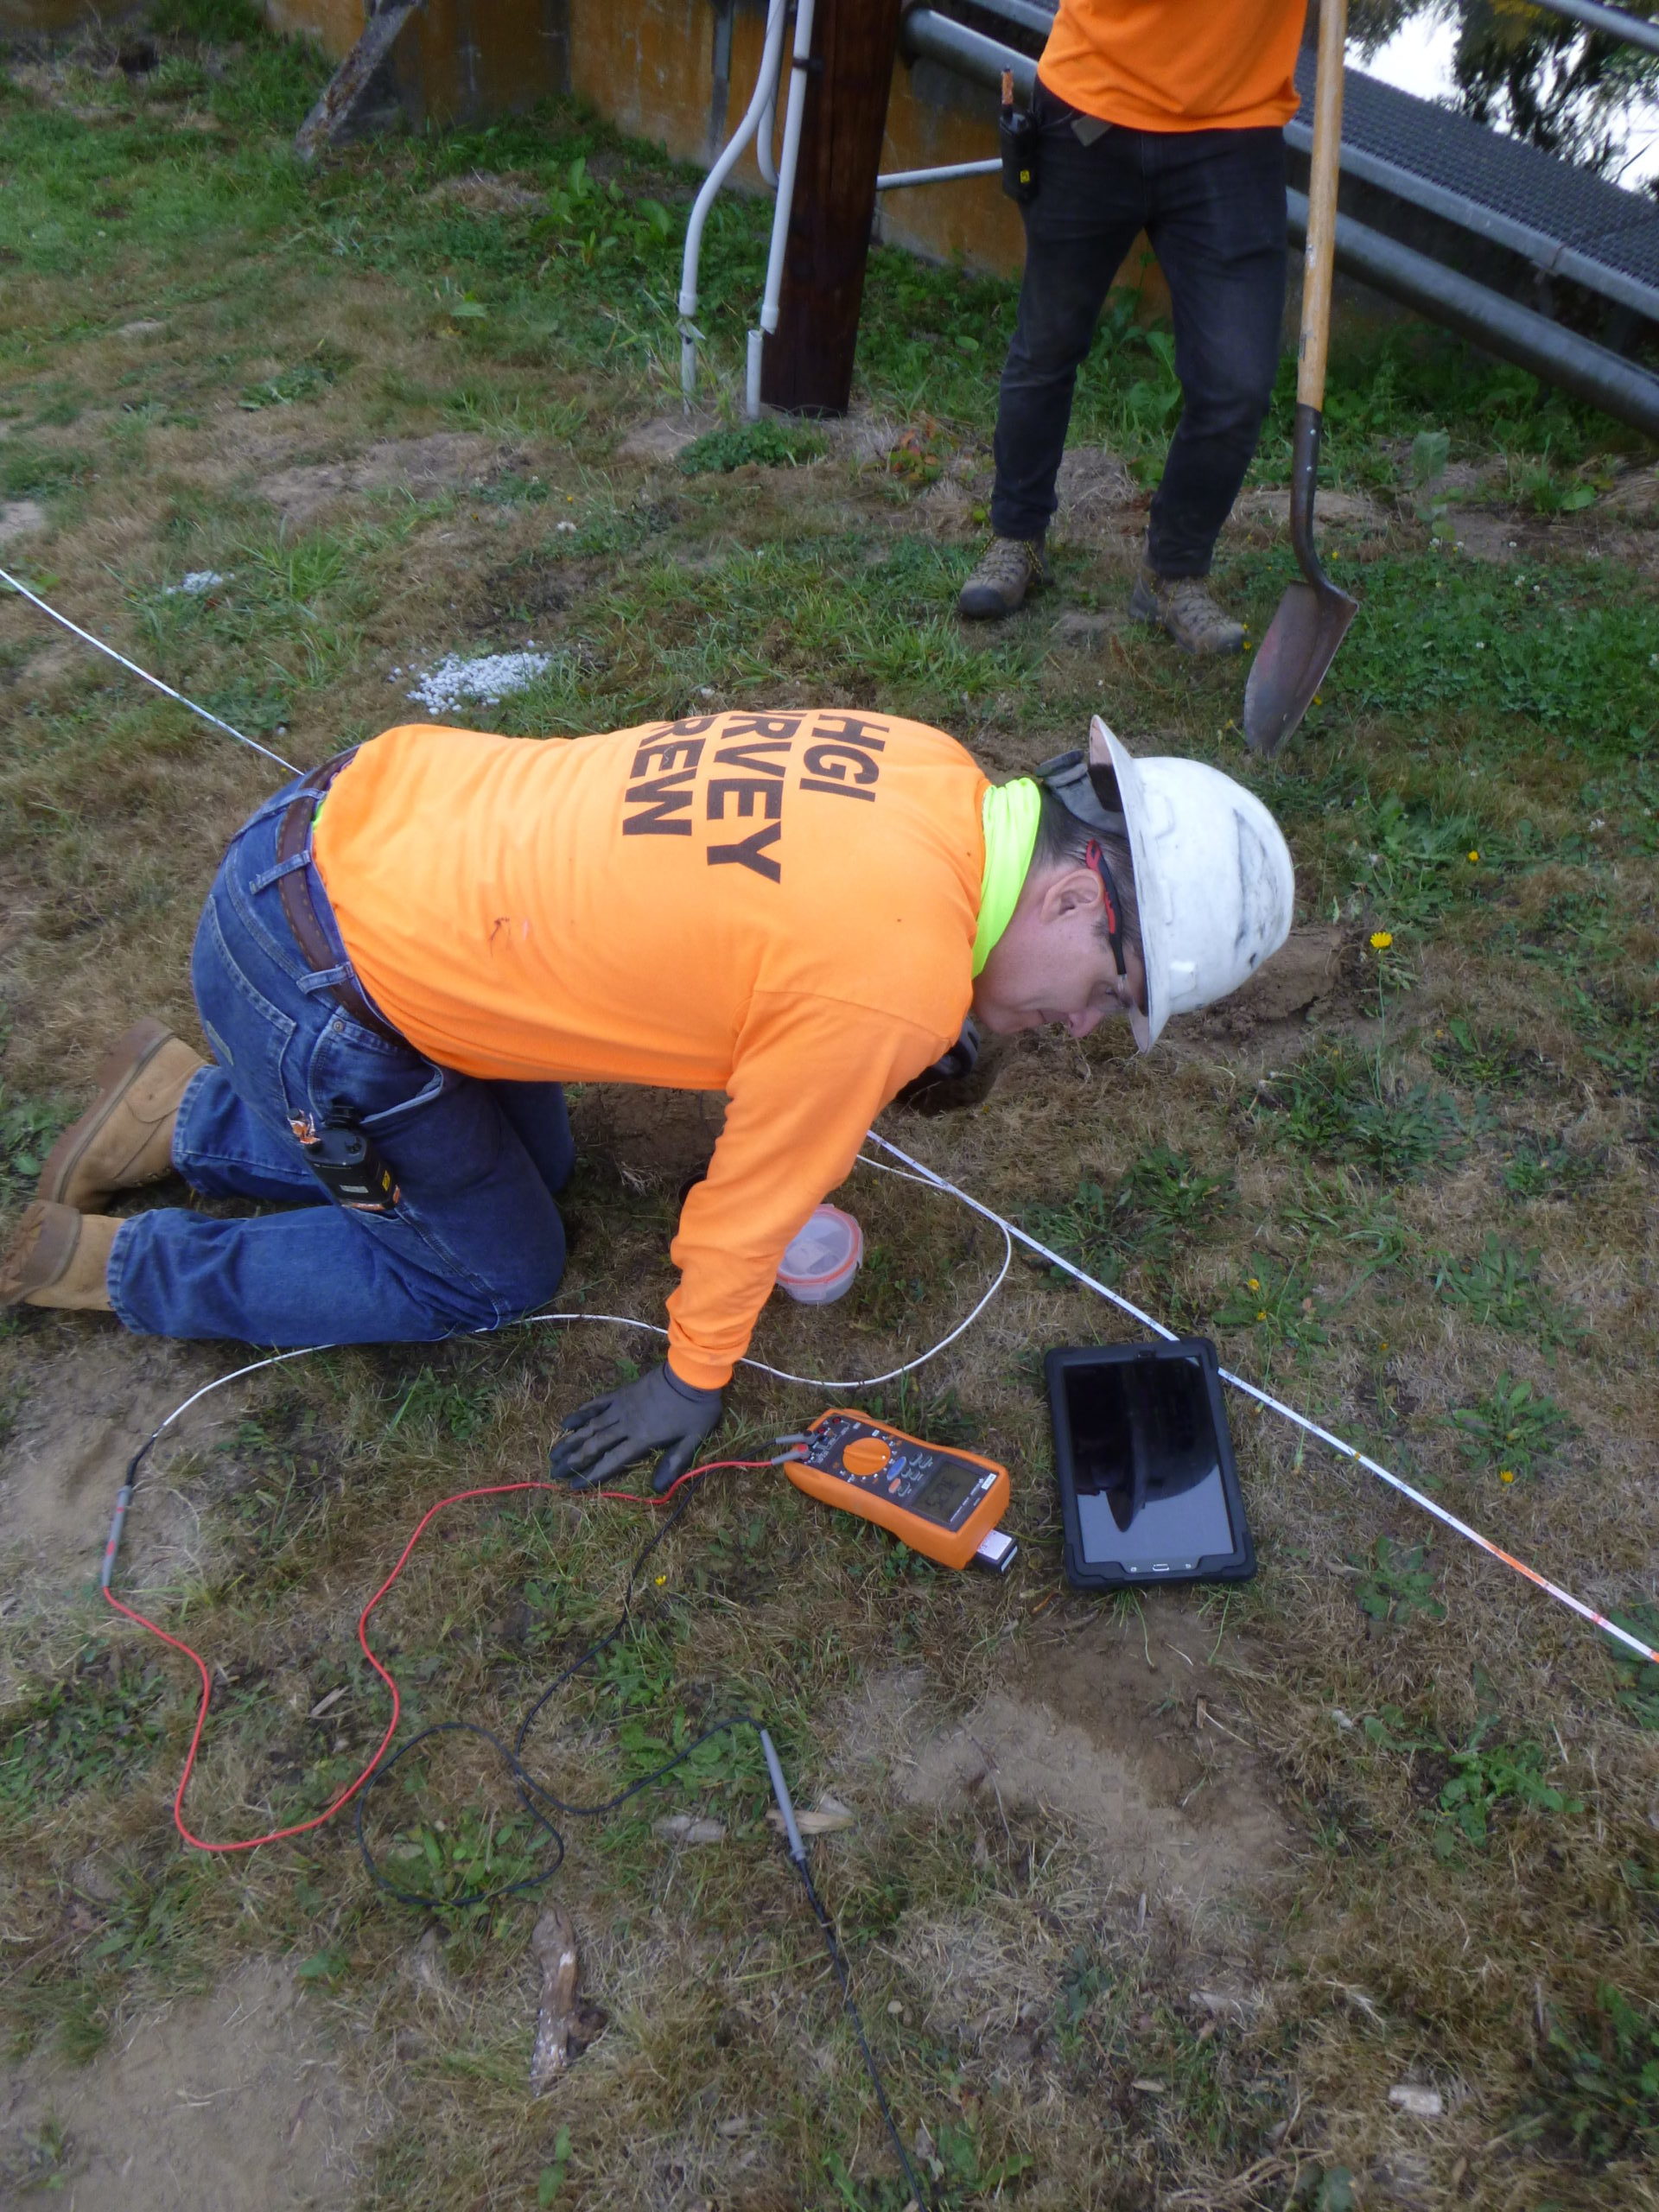
Contractors defined two parallel lines on the downstream side of the dam. The end of the wire at the base point was disconnected and reconnected to the mobile porous pot. Small holes were dug every two meters along each line. The mobile porous pot was placed in each of these small holes, and the difference in voltage between the current location and the far reference point was recorded using voltmeter. After the mobile tests for each line were completed, the team returned to the base point to again record the voltage difference between the far reference and the base point. The purpose of this step is to record how the change in temperature throughout the day influenced the measurements taken. The image below shows the HGI team taking a voltage measurement along one of the lines.
These voltages were recorded and processed by HGI after the site visit. Once processed, the data communicates where water is flowing at the site. Although the results of these two surveys sound similar, it is important to perform both surveys. The surveys are sensitive to interference from metal below ground and water flowing through pipes or structural elements present over the spillway. By performing both tests, we gathered a comprehensive view of where seepage occurs. This has allowed us to identify the best options for replacing the existing dam with a newer and safer dam.

